Callaway RAZR Hawk Driver (Interpreting the Data)
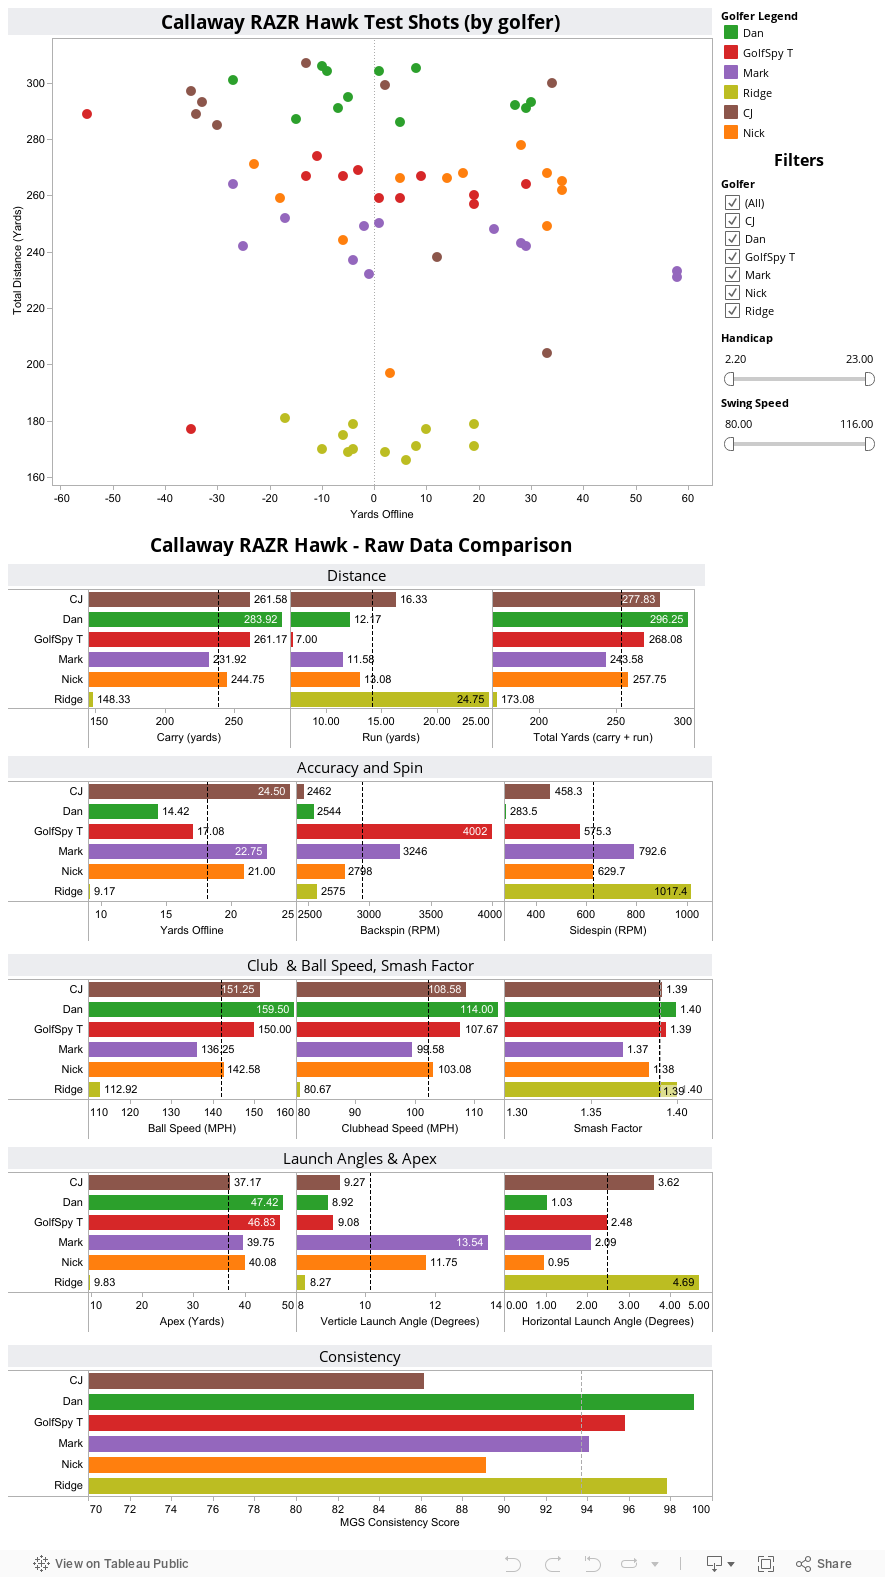
From day one of the new review system we've talked about not only the importance of data, but the importance of actually being able to share that data with our readers. What you see below is each and every shot that our 6 golfers took during the test process. Hovering over any point on the map will give you all the pertinent details of that particular shot. Raw averages were compiled for each and every piece of data we culled from our simulators. If the screen looks a bit cluttered for your taste you can simply de-select any golfer to remove his data from the charts.
On each of the bar graphs, we include two reference lines. The dotted gray line will always represent the average for all golfers for whom we collected data. The dotted black line represents the averages for only those golfers you select. This way you are able to quickly see how the numbers from an individual, or sub-set of testers compares to both each other and the testing group as a whole. We also include sliders which allow you to filter golfers based on driver swing speed and handicap.
What to Look For
Our performance scores are built on calculated averages. While we think they are a solid indicator of how a given club will perform, they don't always tell the whole story. The first thing that caught my eye when building this data page was my spin results. With my club head speed, I'd like to see that number down by 1,000 RPMs or so (and I'd probably benefit from a boost in launch angle as well). I tried the 10.5° head, but the increased spin actually cost me distance. Given that I hit this club as long as anything this season, and did so without the benefit of closer to ideal launch conditions, I'm even more intrigued by what I could do with the right shaft. I'm going to start experimenting with the Tour model to see if the spin numbers improve. The other golfers in our sample pool achieved much more reasonable spin rates with the stock shaft, however; this is clearly one of those cases where the one size fits all stock shaft approach doesn't work.
You should also take a look at the side spin numbers. While higher isn't always bad, when compared to the PING K15 (I told you those numbers were low), they do indicate significantly higher side spin rates. That shouldn't be considered a negative, however; considering the drivers appeal to different market segments.
Finally, a note about Smash Factor calculations. We've noticed over the last several driver reviews that the numbers appear lower than we think they ought to be. The explanation is relatively simple. The 3Trak simulators we use rely on two cameras to track the ball from the point of impact. While able to precisely measure things like launch angle and ball speed, the cameras don't actually capture club head speed. Instead the simulators look at the data collected as the ball moves through the window where that data is captured. It then uses that data to extrapolate the swing speed. Basically the simulator provides an estimated swing speed, rather than an actual swing speed. Based on some rough calculations of my own, I believe that the simulators tend to overestimate swing speed by between 4%-6%. We're going to dig into this a bit deeper, but for now it's best to use Smash Factor for relative, rather than absolute comparisons. Swing speed, and smash factor aside, we believe launch, spin, and most importantly distance numbers to be accurate.
How are we doing?
If there's anything you'd like us to try and add to these interactive pages we generate, stop by the MyGolfSpy forum and let us know. If it's possible, we might just do it.