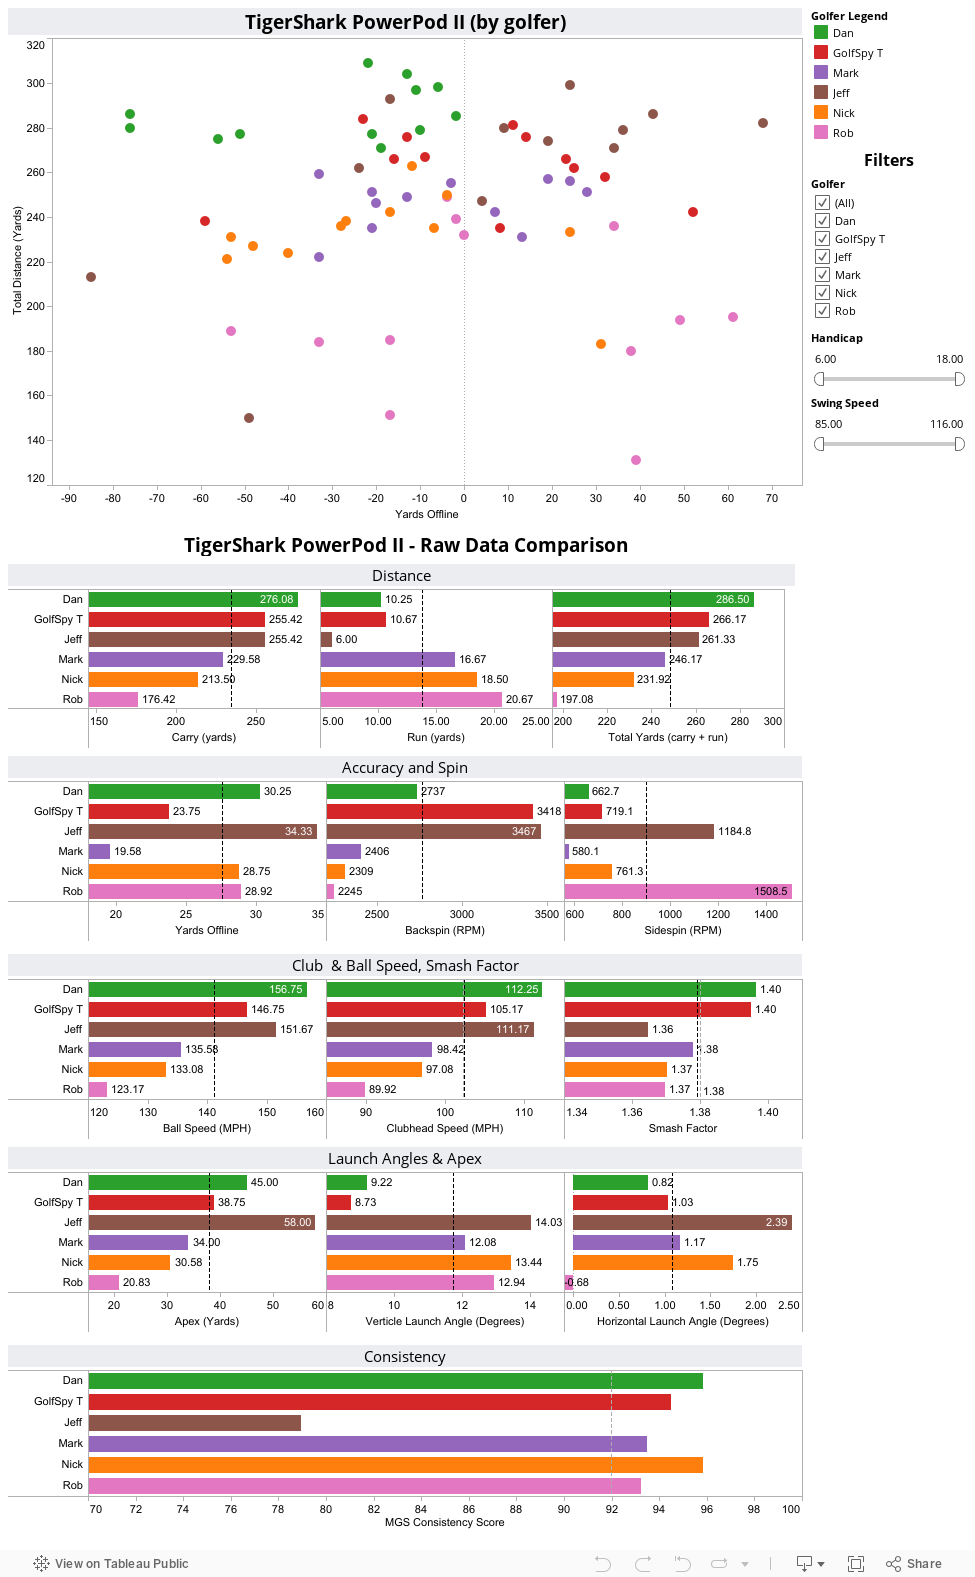
From day one of the new review system we've talked about not only the importance of data, but the importance of actually being able to share that data with our readers. What you see below is each and every shot that our 6 golfers took during the testing process for the TigerShark PowerPod II. Hovering over any point on the map will give you all the pertinent details of that particular shot. Raw averages were compiled for each and every piece of data we culled from our simulators. If the screen looks a bit cluttered for your taste you can simply de-select any golfer to remove his data from the charts.
On each of the bar graphs, we include two reference lines. The dotted gray line will always represent the average for all golfers for whom we collected data. The dotted black line represents the averages for only those golfers you select. This way you are able to quickly see how the numbers from an individual, or sub-set of testers compares to both each other and the testing group as a whole. We also include sliders which allow you to filter golfers based on driver swing speed and handicap.
What to Look For
Accuracy number not withstanding, what I find most interesting about the PowerPod II are the spin numbers. Noteworthy is that for of our testers posted backspin numbers below 3000 RPM, and the group average was 2764 RPM; the lowest of any driver tested. Of course, I'd be remiss if I didn't point out that with an average of 902.7 RPM, the PowerPod II produced the highest average side spin (mostly left spin) of any driver we've tested to date. In fact, none of our testers was able to personally match the average spin numbers for the PING K15 driver we reviewed earlier this season.
How are we doing?
If there's anything you'd like us to try and add to these interactive pages we generate, stop by the MyGolfSpy forum and let us know. If it's possible, we might just do it.